In today’s schools, there is no escaping technology. Since it is such a powerful force in our culture, it must be incorporated into education.
A famous proverb states, “I hear something and then forget it. I listen, and I comprehend. I do, and I remember.”
The proverb holds true because educational research shows that the most beneficial learning occurs when students consciously develop their own mathematical understanding. Some students, especially younger students, can find abstract concepts difficult to grasp. Virtual Manipulatives can help all students improve their sense-making skills, but they’ve been shown to help students who are at-risk, learning disabled, or have reduced English proficiency to grasp the symbolic language of math.
What are physical and virtual manipulatives?
Physical manipulatives, often known as concrete manipulatives, are physical tools that are used as teaching resources to involve students in hands-on learning of math concepts. It is vital for learners to have a variety of materials to manipulate, enabling them to help build their own mathematical thinking and knowledge with Base 10 Blocks and Fraction Circles. This will give them the opportunity to sort, identify, measure, and explore.
Virtual manipulatives are cognitive, technical tools that are a dynamic virtual representation of physical manipulatives that can be moved, rotated, and transformed in the same way that a three-dimensional object can. Virtual manipulatives for math’s, like physical manipulatives, provide learners with the same ability to make sense and see relationships as a result of their behaviors. While virtual manipulatives and physical manipulatives have some similarities, virtual manipulatives have unique characteristics as cognitive resources that go beyond the capabilities of physical manipulatives.
Virtual Manipulatives are tools that enable students to explore math concepts by manipulating objects. Since most of the applications are accessible, they are far less expensive than concrete ones. Math principles can now be brought to life using online virtual manipulatives.
Benefits of virtual manipulatives.
The student must demonstrate some effort in order to obtain mathematical ideas from dealing with physical manipulatives (like blocks). Many virtual manipulatives for maths, on the other hand, have built-in constraint systems that aid in sense-making and make mathematical concepts more explicit as the student interacts with the resource. Digital tools respond to the learner’s behaviors, provide prompts and instructions that help the user concentrate on the mathematics in the lesson, while physical manipulatives do not provide precise and guided feedback and interaction.
Some virtual manipulatives for maths may be modified, such as the form of the onscreen object or the addition of mathematical notations to the object. Another advantage is accessibility since the online world allows for virtual manipulatives to be accessed at any time.
Students with psychomotor challenges who may not be able to effectively handle the tiny individual parts may have access to a computer resource that helps them to perform equally well. Additionally, students who may be prone to misbehavior may have a way to engage without being able to throw or distract others with physical items.
ORYX Learning offers a wide range of engaging math manipulatives to ensure material comprehension and mastery. Here are a few examples of dynamic virtual math manipulatives that will enhance the classroom and at-home learning experience.
Algebra Tiles:
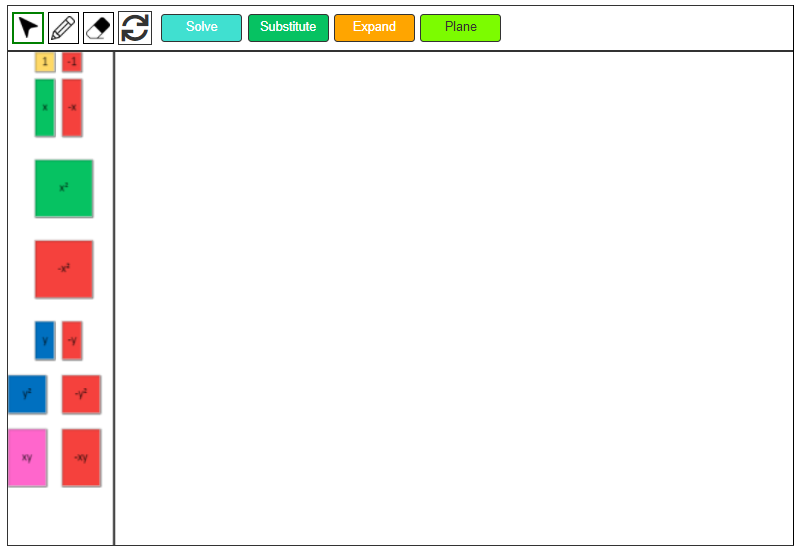
Algebra tiles are a virtual mathematical manipulative. Students can better understand algebraic thinking and definitions by using these algebra tiles. Learn how to represent and solve algebraic problems by using algebra tiles to represent variables and constants. Solve equations, replace variable expressions, and factor and expand. Learners can make their way through algebra by adding tiles, removing zero sets, and modeling equations. Explore and practice this amazing digital math manipulative.
Integer Chips
Integer chips allow students to better understand the addition of negatives and positives. To model integer addition and subtraction, use integer chips. Colored chips can be used to represent integers when modeling integers. A positive number can be represented by one color, while a negative number can be represented by another. Explore and practice this digital math manipulative.

Base Ten Blocks:
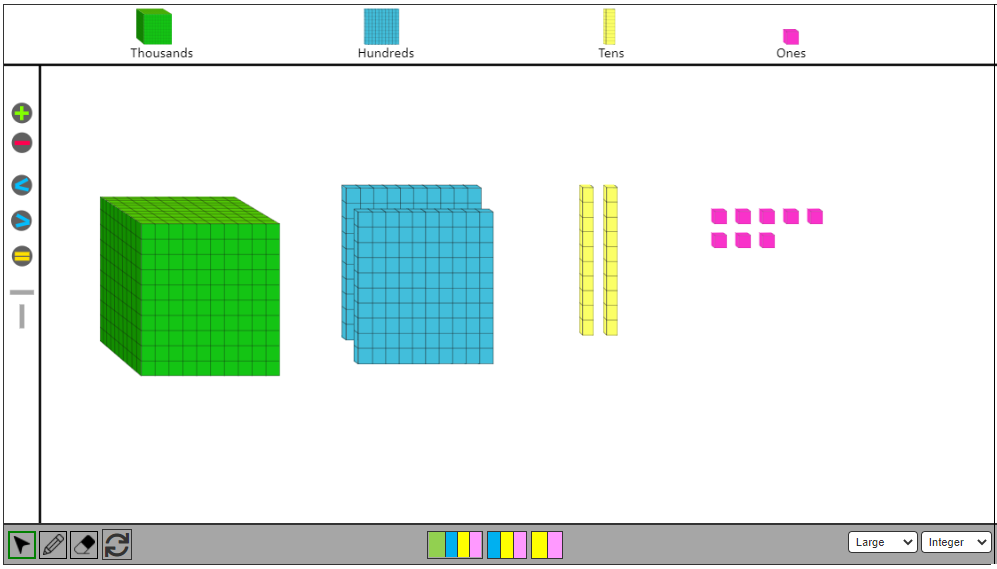
Students learn basic mathematical concepts such as addition, subtraction, number sense, place value, and counting with base ten blocks, a mathematical manipulative. These blocks can be manipulated in different ways to express numbers and patterns. Use the base ten blocks to add or subtract. Explore and practice this amazing digital math manipulative.
Fraction Models:
Fraction models are important for gaining a conceptual understanding of fractions. Fraction sets, whether rectangular or circular, can be used to help students understand that fractions are pieces of a whole, compare fractions, produce equal fractions up to 100, and investigate fraction operations. The circular model emphasizes the part-whole idea of fractions and the sense of the relative size of a part to the whole, whereas the rectangular model is simpler for students to draw precisely. Use the first slider to adjust the parts of the whole model and the second slider to adjust the number of parts shaded and see how they alter the representations and models. Explore and practice this amazing digital math manipulative.

Number Lines:
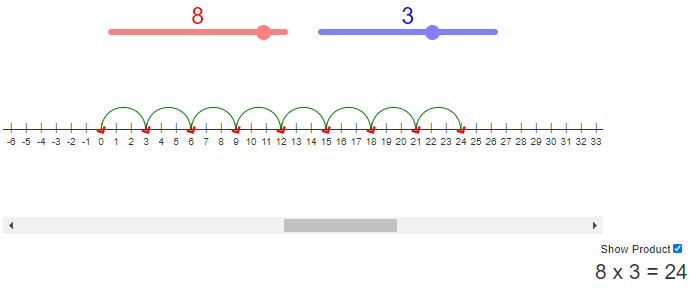
Number Lines is an effective math manipulative that helps students visualize number sequences and demonstrate methods such as counting, comparing, adding, subtracting, multiplying, and dividing. Use the interactive number lines labeled with whole numbers, integers, fractions, or decimals to practice number relationships. Explore and practice this amazing digital math manipulative.

Geometry:
An interactive coordinate plane can be used to graph coordinates in one, two, or four quadrants; show transformations of geometric figures; display data in various forms, and demonstrate numerous algebraic concepts and relationships. Explore and practice this amazing digital math manipulative.

Measure and Estimate Angles:
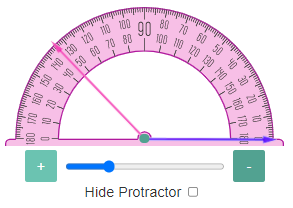
Learn how to use a protractor through this interactive math manipulative. The virtual protractor can be used to manipulate and investigate different angles. Practice calculating and estimating angles with the online protractor method. Explore and practice this amazing digital math manipulative.
Pie Chart:
A pie chart is a circular graph that displays data in an easy-to-read pie slice format. Each slice represents a data category, and its size is proportional to the amount of data it represents. Use the interactive pie chart to represent information as a percent. Explore and practice this amazing digital math manipulative.

Hundreds Chart:
This is a highly effective math manipulative for kindergarten. This math manipulative helps students in counting, skip counting, addition, subtraction, and multiplication are all explored using the interactive hundreds table. A number chart provides a visual guide for learners to see how numbers are arranged and organized. Explore and practice this amazing digital math manipulative.

Clock:
When learning to read time to the hour or to the nearest minute, the interactive clock is most useful. Use the slider to see how the hands on the clock move and read time to the nearest minute. Explore and practice this amazing digital math manipulative.

Data and Graphs
This interactive tool is designed to create and teach graphs and charts in an engaging manner.
A line graph, also known as a line chart, is a type of chart used to visualize the value of something over time. The line graph consists of a horizontal x-axis and a vertical y-axis. Use the interactive tool to plot points to determine the relationship between two sets of values, with one data set always being dependent on the other set.
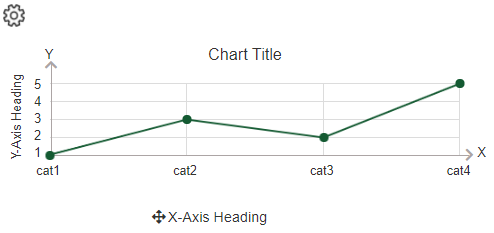
Line Graph
This interactive tool is designed to create and teach line graph in engaging manner.
Instructions:
- Use settings icon above to define categories, axis, and interval.
- Click on chart titles, axis labels and categories to edit.
- Click and draw points on the graph to form a line.
- Use sketchpad and notepad on the right for writing problems or notes.
Bar graphs are ideal for comparing two or more values, or values over time. Data is displayed either horizontally or vertically. Single bar graphs are used to convey discrete values of an item within a category. A double bar graph is used to display two sets of data on the same graph. The information in a double bar graph is related, and it compares one set of data to another.

Single and Double Bar Graph
This interactive tool is designed to create and teach bar graphs in engaging manner.
Instructions:
- Use settings icon above to choose between single or double bar graph, define categories, axis, and interval.
- Click on chart titles, axis labels and categories to edit.
- Click and draw bars on the graph.
- Use sketchpad and notepad on the right for writing problems or notes.
The histogram is used for variables whose values are numerical and measured on an interval scale. It is generally used when dealing with large data sets (greater than 100 observations). A histogram can also help detect any unusual observations (outliers) or any gaps in the data.

Histogram
This interactive tool is designed to create and teach histograms in engaging manner.
Instructions:
- Use settings icon above to define categories, axis, interval and bar color.
- Click on chart titles, axis labels and categories to edit.
- Click and draw bars on the graph.
- Use sketchpad and notepad on the right for writing problems or notes.
A line plot is a graph that shows the frequency of data along a number line. It is best to use a line plot when comparing fewer than 25 numbers. It is a quick, simple way to organize data.
Explore and practice this amazing digital math manipulative.

Line Plot
This interactive tool is designed to create and teach line plot in engaging manner.
Instructions:
- Use settings icon above to define categories, axis, and interval.
- Click on chart titles, axis labels and categories to edit.
- Click and draw plot on the graph.
- Use sketchpad and notepad on the right for writing problems or notes.
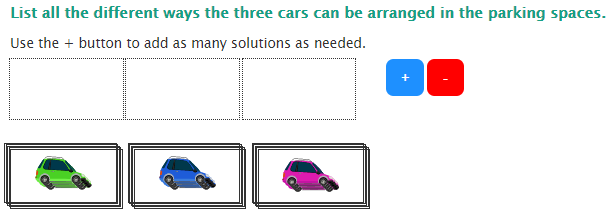
Permutations:
A combination is a mathematical technique for calculating the number of possible arrangements in a collection of items where the order of the items is not important. You can choose the elements in any order in combinations. Explore and practice this amazing digital math manipulative.
Teachers will provide an outstanding addition to their teaching toolkit by using Oryx learning interactive virtual math manipulatives. They can not only provide directed exploration opportunities for students but also allow their learners to develop a solid understanding of mathematics concepts. This engaging and dynamic range of math virtual manipulatives will assist students in demonstrating and sharing their knowledge. Students will not only understand abstract mathematical concepts but also develop a richer and more complex understanding of concepts. Use Oryx Learning math manipulatives to help clarify misconceptions and build connections between concepts and representations.


