
Statistical Questions
Concept
Identify the characteristic of the given statistical distribution.
Rules
Analyze the graph given and describe the center and spread of a statistical distribution.
Example
The distribution below shows represents scores on a recent 30 point quiz. Find the center of distribution.

Solution
Since the distribution is non-symmetric, which we can tell by looking at the plot that the left and right sides are not the same, the median should be used to describe the center and the IQR for the spread. The median is represented by the line going vertically through the box, which in this case is at 14.
Practice Statistical Questions
Practice Problem 1
An archer records his scores at 7 shoots throughout the season. His scores are as follows:
278, 300, 195, 265, 288, 278, and 272
Find the median.
![]()

Practice Problem 2
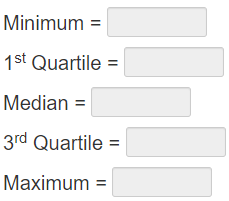
A list of 9 students’ quiz scores on a 20 point quiz is listed below. Find the five-number summary.
19, 19, 17, 20, 18, 14, 8, 20, 16.
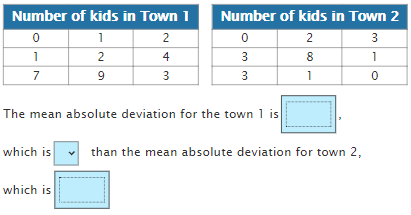
Practice Problem 3
The two tables below show the number of kids per family in two different towns. Find the mean absolute deviations and fill in the blanks. Round your answers to the nearest hundredths.
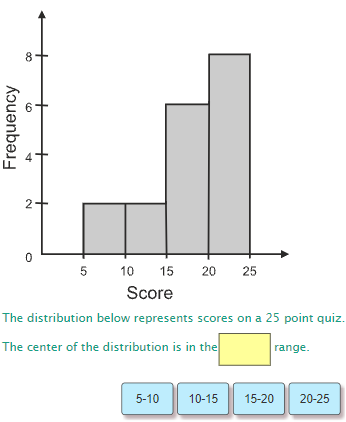
Practice Problem 4
Drag the correct answer choice to complete the statement.

Univariate data: Data with one variable, such as test scores.
Bivariate Data: Data with two variables, or pairs of numerical observations.
Mean: means average.
Median: It is the middle number of the data set when in order from the least to the greatest.
Mode: It is the number that occurred the most often.
Range: It is the difference between the highest and lowest values in the set.
Bar Graph: shows the number of items in specific categories.
Double Bar Graph: compares two sets of categorical data.
Circle Graph: compares parts of the data to the whole.
Histogram: shows the frequency of data divided into equal intervals.
Line Graph: shows change over a period of time.
Box and Whisker Plot: It shows measures of variation for a set of data. Also known as box plot.
The Five-Number Summary: It includes the minimum, Q1, median, Q3, and maximum values.
Q1: It is the first quartile or the median of the first half of the data set.
Q3: It is the third quartile or the median of the second half of the data set.
Interquartile range (IQR): It represents the middle 50%. It spans from the 25th percentile to the 75th percentile and is represented by the box in a boxplot.
Mean absolute deviation: is an indicator of the spread of the data, or how far each data value is from the mean. The higher the mean absolute deviation, the further spread the data is from the mean.
Standard deviation: is a calculated value that shows how the data deviates from the mean of the data.
A gap is where there are no data values in a distribution.
A peak is the where the most frequently occurring value or interval of value is located.
An outlier is a data value that is 1.5 times the interquartile range from the first and third quartiles.
A distribution of a set of data shows the arrangement of data values.
Symmetric distribution: If the left side of a distribution looks like the right side of a distribution.
Related Skills
Scatter Plots
Lines of Best Fit
Two-Way Tables