
Proportional Relationship on a Graph
Concept
A proportion is a statement that two ratios are equal. It can be written in two ways: as two equal fractions ; or using a colon,
.
Rules
Identifying proportional relationships through graphs:
To determine whether two quantities are proportional, graph the quantities on a coordinate plane. If the graph of the two quantities is a straight line through the origin, then the two quantities are proportional.
Identifying proportional relationships through tables:
Write the ratios as fractions and then reduce them.
If the reduced fractions are the same, the ratios are proportional.
Example
Which line represents a proportional relationship?

Solution
1. If the graph is a straight line through the origin, then it represents a proportional relationship.
a. Graph A is a straight line and goes through the origin, so it represents a proportional relationship.
b. Graph B is a straight line but does not go through the origin, so it does not represent a proportional relationship.
Answer: A
Practice Proportional Relationship on a Graph
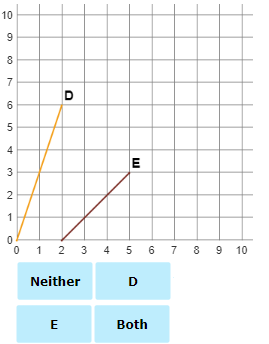
Practice Problem 1
Which line represents a proportional relationship?

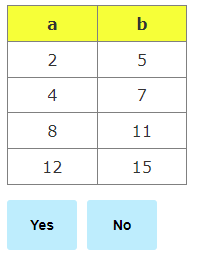
Practice Problem 2
In the following table, are a and b in a proportional relationship?
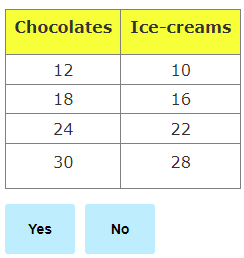
Practice Problem 3
The ratio of chocolates and ice-creams in the boxes is given in the table below. Is the number of chocolates proportional to the number of ice-creams in each box?
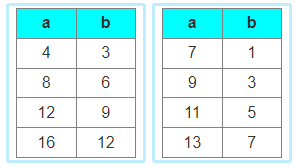
Practice Problem 4
Select all the tables which show a and b in a proportional relationship.

Proportional – when two quantities have a constant ratio or unit rate.
Non-proportional – when two quantities don’t have a constant ratio or unit rate.
Equivalent ratios – ratios that have the same value.