
Pictographs
Concept
In Statistics, pictographs are charts that are used to represent data using icons and images relevant to the data. A key is often included in a pictograph that indicates what each icon or image represents. All icons in the pictogram must be of the same size, but we can use the fraction of an icon to show the respective fraction of that amount.
Pictographs in maths are typically used in concepts like data handling. They help in laying the foundation for data interpretation based on pictorial information.
All the symbols/icons must be of the same size. A fraction of an icon can also be used to show data.

Rules
1. Firstly, we need to collect the data of the different categories we want to represent. We then form a table or list.
2. Review the collected data and based on it pick a symbol or picture that accurately represents the data.
3. Based on the frequency of the data, decide the frequency for one symbol. This can be done by setting a numerical value that one symbol will represent. This key or numerical value must be written along with the pictograph.
4. Finally, drawing the pictograph by initially drawing two columns that represent the category and the data. Then, draw the actual symbols representing the frequencies. These symbols can be drawn as fractions as well if the frequency is not a whole number or based on the key.
5. Check the labeling and review your pictograph and make sure it correctly represents the data.
Example
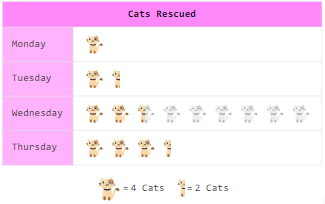
Use this data to complete the missing row in the pictograph.
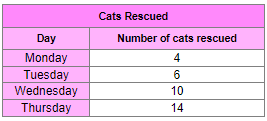
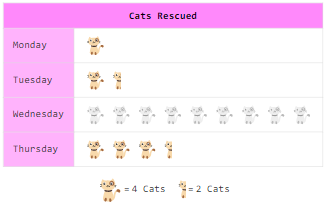
Solution
Practice Pictographs
Practice Problem 1
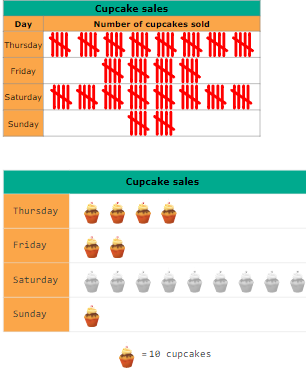
The pictograph shows the sale of cupcakes.
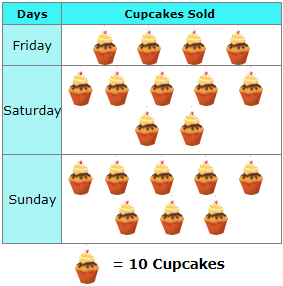
On which day did they sell 40 cupcakes?

Practice Problem 2
The pictograph shows the number of seashells collected by Amy, Zoey and Ashley.
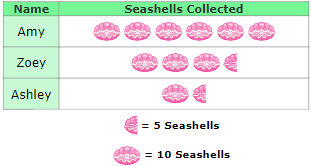
How many more seashells did Zoey collect than Ashley?
![]()
Practice Problem 3
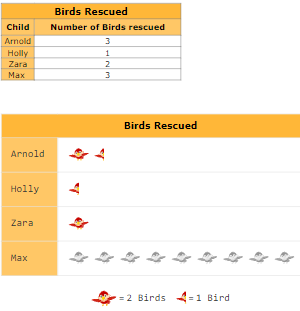
Use this data to complete the missing row in the pictograph.
Practice Problem 4
Use this data to complete the missing row in the pictograph.

A pictograph is a representation of data using images or symbols.
A Key denotes the value of the symbol.
Pre-requisite Skill
Read Tally Marks and Tables