
Comparing Functions
Concept
A function in math is visualized as a rule, which gives a unique output for every input x. There are many ways to represent functions. For example, a function can be represented with an input-output table , with a graph, and with an equation.
Sometimes a problem asks us to compare two functions which are represented in different ways. For example, you might be given a table and a graph, and asked which function is greater for a particular value, or which function increases faster.
Rules
Compare two functions by determining the rate of change.
To find the rate of change from a linear function:
The coefficient of x (slope) is the rate of change of the linear function.
To find the rate of change from a linear function graph:
1. Select any two ordered pairs from the graph.
2. Subtract the y-coordinates of both ordered pairs to find the vertical change. This is the rise.
3. Subtract the x-coordinates of both ordered pairs to find the horizontal change. This is the run.
4. Calculate the slope by dividing the rise by the run.
To find the rate of change from a function table:
1. Select any two ordered pairs from the table.
2. Subtract the y-coordinates of both ordered pairs to find the vertical change. This is the rise.
3. Subtract the x-coordinates of both ordered pairs to find the horizontal change. This is the run.
4. Calculate the slope by dividing the rise by the run.
Example
The number of sales (y) per day (x) on Jane’s website can be represented by y = 12x.
The number of sales on Sarah’s website is shown in the graph below. Whose website gets more sales per day?

Solution
The rate of Jane’s sales is 12 sales/day. The graph of Sarah’s sales has a rate of change of , so she gets 10 sales/day.
Jane’s website gets more sales per day.
Practice Comparing Functions
Practice Problem 1
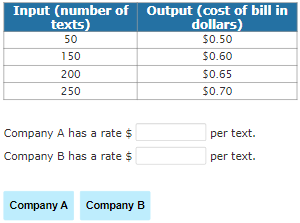
You have recently begun searching for phone billing plans. Phone Company A charges can be represented by the equation y = 0.2x, where x represents the number of texts you send a month and y is the total bill for the month. The billing plan for phone company B is represented by the table below. Which company has the lowest rate for texts?
Round your answers to the nearest hundredths.

Practice Problem 2
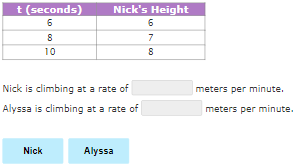
Nick and Alyssa are racing up a wall. Alyssa’s height on the wall is given by the equation a = t + 5, where (a) is Alyssa’s height in meters after climbing (t) minutes. Nick started racing at the same time as Alyssa and is also climbing at a constant speed. His height is shown in the table below. Who is climbing at a slower rate?
Round your answers to the nearest tenths.
Practice Problem 3
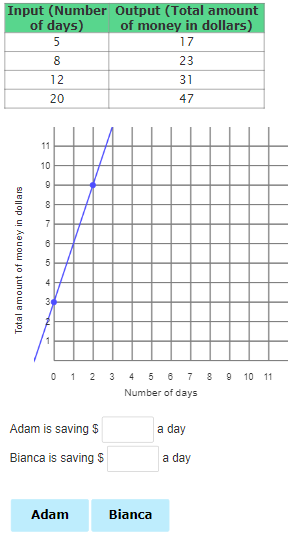
The amount of money saved (y) after a number of days (x) for Adam is represented by the graph below. The amount of money saved (y) after a number of days (x) for Bianca is represented by the table. Who is saving more money per day?

Function – is an expression, rule, or law that defines a relationship between one variable (the independent variable) and another variable (the dependent variable).
Rate of Change – ratio of the “vertical change” to the “horizontal change” between (any) two distinct points on a line. It is also called the slope.
Pre-requisite Skills
Slope
Representing Relationships
Relations
Functions
Linear Functions