Dot Plot
Concept
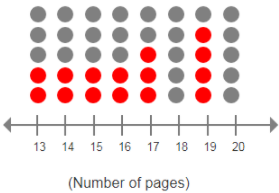
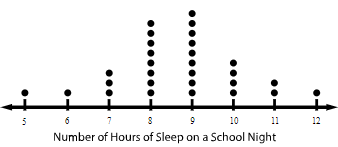
A dot plot is used to represent any data in the form of dots or small circles. It is similar to a simplified histogram or a bar graph as the height of the bar formed with dots represents the numerical value of each variable. Dot plots are used to represent small amounts of data.
Rules
It is best to use a dot plot when comparing fewer than 25 numbers.
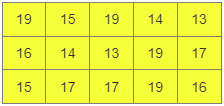
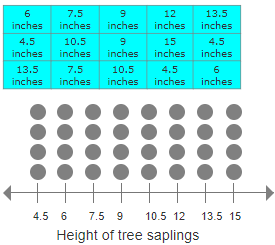
To make a dot plot out of given data, determine a scale that includes all of the data in appropriate intervals. Then plot each number using dots or other marks to show the frequency.
Example
Solution
Practice Dot Plot
Practice Problem 2
The heights of 20 basketball players, in inches, are given below. Answer the following question based on the given data.
68, 70, 70, 71, 75, 80, 81, 82, 84, 75
75, 80, 75, 77, 75, 80, 83, 80, 71, 70
When creating a line plot to represent the data, what would be the highest number on the number line?
![]()

A dot plot is a graph that shows the frequency of data along a number line using dots. It is also called a line plot.
A frequency table is a table that keeps a tally of how often certain events occur.


