
How to Interpret and Create Bar Graphs
Concept
A bar graph is a specific way of representing data using rectangular bars where the length of each bar is proportional to the value they represent. It is basically a graphical representation of data using bars of different heights.
A bar graph is a graph that shows complete data with rectangular bars and the heights of bars are proportional to the values that they represent. The bars in the graph can be shown vertically or horizontally. Bar graphs are also known as bar charts and it is a pictorial representation of grouped data. It is one of the ways of data handling. Bar graphs are an excellent tool when representing data that are independent of one another and don’t need to be in any specific order while being represented. The bars give a visual display for comparing quantities in different categories. The bar graphs have two lines, horizontal and vertical axis, also called the x and y-axis along with the title, labels, and scale range.
Rules
Interpreting a Bar Graph
1. Every bar or column in a bar graph is of equal width.
2. All bars have a common base.
3. The height of the bar corresponds with the value of the data.
4. The distance between each consecutive pair of bars is the same.
5. Use the numbers on the left (Frequency) and the bars above each category to interpret the data value.
Constructing of a Bar Graph
1. Draw two perpendicular lines that intersect each other at a point O. Name the vertical line as y-axis and the horizontal as x-axis.
2. Choose a suitable scale to determine the height of each bar.
3. Draw the bars at equal distance, with corresponding heights on the horizontal line.
4. The space between the bars should be equal.
Example
James counted the animals he saw from his window one day. How many fewer cats did he see than crows?

Solution
1. Look at the bottom of the graph, which shows the types of animals. Locate the “crows” and “cats” labels.

2. Use the numbers on the left and the bars above each animal to determine how many of each he saw outside his window.

He saw 5 cats and 15 crows.
3. To find out how many fewer cats than crows, subtract the number of cats from the number of crows.
15 – 5 = 10
James saw 10 fewer cats than crows.
Practice How to Interpret and Create Bar Graphs
Practice Problem 1
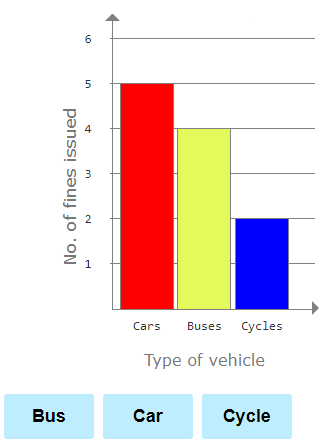
The bar graph shows the types of vehicles fined for traffic violations in a day.
Which type of vehicle received the most fines?

Practice Problem 2
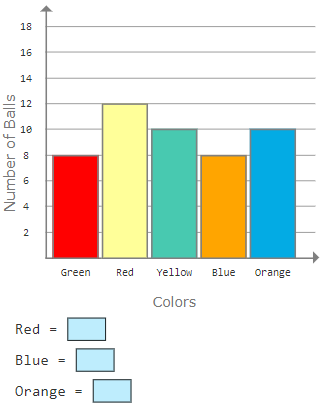
Bar graph shows the different colors students liked.
How many students in total like red, blue and orange?
Practice Problem 3
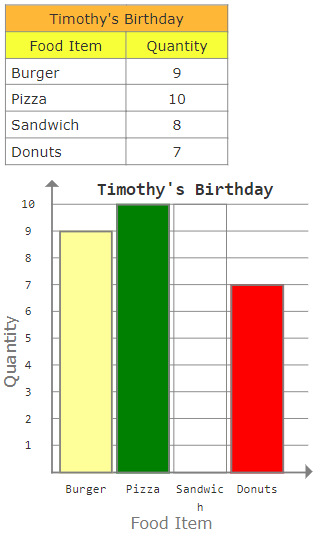
There were several food items at Timothy’s birthday party. The chart below shows the food items and the quantity eaten by his friends.
Use this data to complete the bar graph.
Practice Problem 4
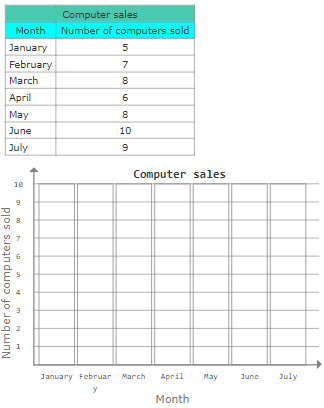
The table below shows the number of computers sold by a company from January to July.
Use this data to complete the bar graph.

A bar graph is a visual way of showing information in which we represent quantities corresponding to different categories by rectangular bars of equal width. The lengths or heights of the rectangular bars compare the quantities in different categories.
Pre-requisite Skills
Read Tally Marks and Tables
Create Pictographs
Read Pictographs