Nonlinear Tables
Concept
A nonlinear function is basically the opposite of a linear function. This gives that the graph of a nonlinear function is not a line, and we can determine whether a function, in tabular form, is nonlinear by observing that the jump in y varies for each unit of change in x.
Rules
How to determine a linear/nonlinear function through tables:
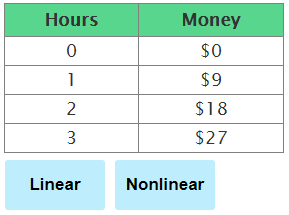
1. Calculate the rate of change (slope) for each ordered pair.
2. If the rate of change is constant, the table represents a linear function.
3. If the rate of change is not constant, the table represents a nonlinear function.
How to determine a linear/nonlinear function through tables and graphs:
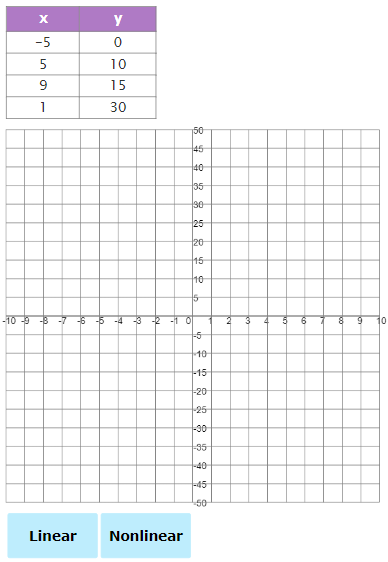
1. Plot the ordered pairs.
2. The points have a linear relationship if a straight line passes through all points.
3. The points have a nonlinear relationship if no straight line passes through all points.
Example
Solution
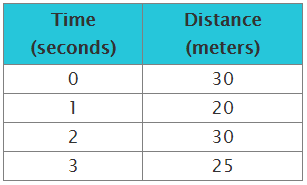
The change in the distance is not constant with each second increase in time, indicating the function is not linear.
Practice Nonlinear Tables

Linear: To fall in a straight line.
Function: A relation in which every member of the domain (input value) is paired with exactly one member of the range (output value).
Linear Function: A function in which the graph of the solutions forms a straight line.
Function Table: A table organizing the domain, rule, and range of a function.
Nonlinear functions are functions whose rates of change are not constant. A nonlinear function has a graph that is not a straight line.
Rate of Change – ratio of the “vertical change” to the “horizontal change” between (any) two distinct points on a line. It is also called the slope.
Related Skills
Algebra Functions
Slope
Direct Variation
Quadratic Functions
Qualitative Graphs


