Tally Charts
Concept
We know that data is a collection of information. When the data is large, it may not be easy to count. So, we make use of tally marks. Tally marks is the quick way of recording the given data by grouping in bunches of five. The first four tallies are marked vertically and the 5th tally in a bunch is marked diagonally across the four tallies.
To count the number of times a value of the variable appears in a collection of data, we use tally mark ( / ). Thus tally mark represents frequency.
Rules
1. Make a rectangular-shaped data table, with three headings at the top. In the first heading box, write your counting or survey category. In the second heading box, write “tally” and in the third heading box, write “total.”
2. Make a tally mark for each count under the “tally” heading. One tally mark is a vertical line. Draw vertical lines for the first four responses for each answer. For the fifth count, draw a diagonal line through the four vertical lines. Four vertical lines with one diagonal line running through it represents a set of five responses. This will make totaling your data easier at the end of the survey, since you count by fives.
3. Total up the tally marks for each category answer or choice. Write the total numbers under the “total” heading.
Example
Solution
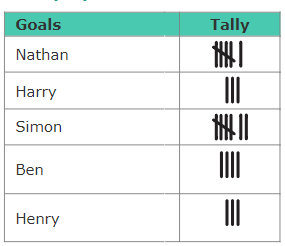
Count the tally marks to find how many goals Harry and Simon scored.
Harry has 3 tally marks. So, Harry scored 3 goals. Simon has 7 tally marks. So, Simon scored 7 goals.
Add 3 and 7. You get 10.
Therefore, Harry and Simon scored 10 goals in total.
Practice Tally Charts

Tally Mark – It is a form of numeral used for counting. The general way of writing tally marks is as a group or set of five lines.
A tally chart is a simple way of recording and counting frequencies. Each occurrence is shown by a tally mark and every fifth tally is drawn diagonally to make a “gate” of five. The tallies can then be counted to give the frequency.
Frequency – The representation of the various observations and tally marks in a form of table is the frequency distribution. The frequency is the number of the times an observation occurs. It is the number of repetitions.
Pre-requisite Skill
Skip Counting by 5s


